Experimental techniques
Sum Frequency Generation Spectroscopy
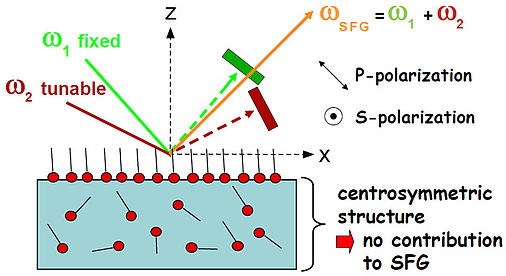
 | SFG is second-order nonlinear process, allowed only in media without inversion symmetry. At surfaces or interfaces the inversion symmetry is necessarily broken, which makes SFG highly surface specific.
|
more about sum frequency generation spectroscopy
The investigation of aqueous electrolyte–air interface encounters a couple of intrinsic challenges. Firstly, the majority of material is dissolved in the bulk and the interfacial region comprises only a tiny fraction of the total material of the system. Consequently, spectroscopic investigations with classical techniques such as Infrared, Raman or UV-spectroscopy are often hampered by the lack of surface specificity and the signals are dominated by bulk contributions. Secondly, the processes at the air–water interface are highly dynamic. On a molecular scale there is a tremendous traffic towards both adjacent bulk phases. Molecules evaporate and condense at the interface and diffuse towards the bulk phase. There is no defined static molecular arrangement and as a consequence, fairly broad spectral features are expected. Moreover, many powerful surface specific techniques such as electron loss spectroscopy have special requirements to the sample and the environment (e.g. UHV-conditions) and cannot be applied to the liquid–air interface.
An elegant alternative which provides an intrinsic surface specificity is provided by non-linear optical reflection techniques based on a second order effect. Second-harmonic-generation (SHG) and sumfrequency- generation (SFG) spectroscopy contributed significantly to our current understanding of liquid–air, solid–liquid and liquid–liquid interfaces. Many fundamental insights on the structure of liquid–air interfaces are based on SHG and SFG experiments which are discussed in the next section.
In an SFG experiment, two laser pulses are coincident in time and space at the interface of a sample. One visible laser pulse is fixed in frequency, while the other is tunable through the infrared region of 1000–3800 cm−1. If the intensities of the incident laser pulses are sufficiently strong to induce a polarisation of the second order in the medium, an SFG signal oscillating at the sumfrequency of the two incident beams may be generated. If the frequency of the IR beam meets a frequency of a vibrational mode of the interfacial molecules, a resonance enhancement of the SFG signal may occur. To put it in simple terms, SFG spectroscopy provides a surface-specific vibrational spectrum.
Where does this interface specificity come from and what are the underlying assumptions?
The electric field propagating through a medium exerts a force on the valence electrons. The binding features of an electron can be described by a Morse type function. For small fields, the displacement of the electrons scales linearly with the applied field strength, while for stronger fields, deviations from the linear behaviour occur. Hence, the borderline between linear and non-linear optics is given by the binding potential of the electrons. Linear optics holds as long as the displacement of the electron occurs in a region where the binding potential can be approximated by a parabola. The induced dipole moment μ can be represented as a power series of the electric field E.
μ = μ0 + αE + βE2 + γE3
The static dipole moment is denoted by μ0, α is the linear polarisability of the electrons, β is the second order hyperpolarisability and so on. Non-linear optical effects are only noticeable once the electric field of the laser pulse is comparable to the inner-molecular fields. The dominant termin the surface spectroscopy is the one of the second order, and the theory commonly used for the interpretation of SHG and SFG surface spectra is based on the electric dipole approximation. Within this approximation, the effect of optical magnetic fields and multipoles are neglected. This assumption can be at stake in some scenarios, especially for the interpretation of non-resonant SHG phenomena. Quadrupolar contributions are much weaker than the dipolar ones, but they scale with the number density and can amount to noticeable levels which may interfere with the surface term. There is no general solution to this problem, and it is often not known a priori in SHG and SFG studies whether interfacial contribution is dominant over that of the bulk in an interface system. Furthermore, it is commonly assumed that the dipoles induced in the molecules are solely due to the external laser field and that contribution from neighbouring molecules can be neglected. The local fields are hard to capture at a molecular level and require further theoretical work. In this framework, the simplest description of SFG is given by
P(2)sf = ε0χ(2)EvisEir ,
where P(2)sf is the second-order non-linear polarisation, ε0 is the vacuum permittivity, χ(2) is the second-order non-linear susceptibility, a third rank tensor describing the relationship between the incident electric fields vectors Evis and Eir and the resultant polarisation. A simple symmetry consideration reveals that within the dipolar approximation, SHG or SFG cannot occur within media with inversion symmetry. Inversion symmetry means P goes to −P if the direction of E is inverted, leading to vanishing polarisation response P(2).
P = −P if E = −E, hence P(2) = 0.
In the framework of the dipole approximation, SHG or SFG cannot occur in isotropic bulk media such as fluids or gases. At the interface of two isotropic media, the symmetry is broken and the molecules possess a net orientational order reflecting the asymmetry of the environment. These molecules are probed by SHG and SFG leading to an interface specific response. It is important to realise that SHG or SFG per se does not provide information of the interfacial width without further assumptions. The signal is generated within the interfacial region and determined by the integral of the molecular orientational distribution function in between both bulk media.
For more information, you can see a review on SFG spectroscopy by Hubert Motschmann and Patrick Koelsch: PDF download
Oscillating bubble technique
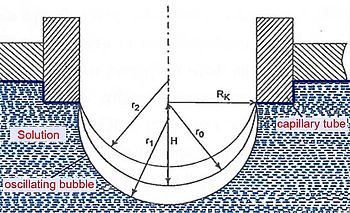
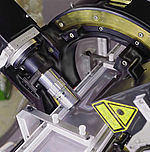
 | The oscillating bubble technique allows determination of the surface dilational viscoelastic properties of an adsorption layer at the liquid-air and liquid-liquid interfaces. It has been developed at the Max-Planck Institute of Colloid and Interfaces.
|
more about oscillating bubble technique
A small hemispherical bubble is formed at the tip of a capillary with a radius of about 0.2 mm. The bubble is forced in a sinusoidal oscillation by a piezoelectric translator which is directly immersed in the liquid. As a result, a harmonic modulation of the pressure in the chamber is observed and recorded by a sensitive pressure transducer located at the bottom of the chamber. The amplitude of the pressure response and the phase-shift between piezo oscillation and pressure signal are evaluated via a phase sensitive lock-in detection scheme. The amplitude of the pressure response is proportional to the magnitude of the complex surface dilational module E, while the phase-shift yields the imaginary part of the modulus, in other words the surface dilational viscosity.
The implemented design give access to the frequency range of 1-500 Hz and allows the determination the real- and imaginary part of the complex surface dilatational elasticity module
Ellipsometry
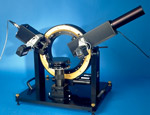 | Ellipsometry is a very sensitive measurement technique that uses polarized light to characterize thin films, surfaces, and material microstructure. Usually the polarization of light changes upon reflection. These changes are measured by an ellipsometer and interpreted on the basis of model calculations. |
more about ellipsometry: capabilities, technique, experiments...
What information can be obtained using ellipsometry?
-
Layer Thickness with an accuracy of 0.1nm
-
Optical constants of a substrate
-
Orientation of molecules
-
Mass coverages at surfaces
-
Visualization of textures and morphology
The data accumulation is fast that you can follow in situ changes at interfaces such as corrosion, adsorption and so on. Ellipsometry is a versatile technology that has been used for over a century. The following guides you through some key concepts.
Basics
Polarized light
Light is an electromagnetic wave and all its features relevant for ellipsometry can be described within the framework of Maxwell's theory. The relevant material properties are the complex dielectric function epsilon or alternatively the corresponding refractive index n.
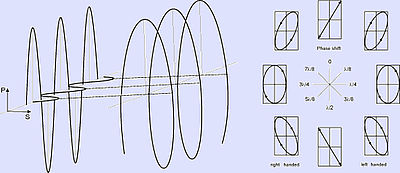
An electromagnetic wave consists of an electric field E and a magnetic field B. The field vectors are mutually perpendicular and also perpendicular to the propagation direction as given by the wave vector k. All states of polarization are classified according to the trace of the electrical field vector during one period. Linearly polarized light means the electrical field vector oscillates within a plane, elliptically polarized light means that the trace of the electric field vector during one period is an ellipse. A convenient mathematical representation of a given state of polarization is based on a superposition of two linearly polarized light waves within an arbitrarily chosen orthogonal coordinate system.
The different states of polarization are depicted in the following Fig.:
Principle
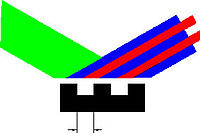
Ellipsometry refers to a class of optical experiments which measure changes in the state of polarization upon reflection or transmission on the sample of interest. It is a powerful technique for the characterization of thin films and surfaces. In favorable cases thicknesses of thin films can be measured to within Angstroem accuracy, furthermore it is possible to quantify submonolayer surface coverages with a resolution down to 1/100 of a monolayer or to measure the orientation adopted by the molecules on mesoscopic length scales. The high sensitivity is remarkable if one considers that the wavelength of the probing light is on the order of 500 nm. The data accumulation is fast and allows to monitor the kinetics of adsorption processes. Many samples are suitable for ellipsometry and the only requirement is that they must reflect laser light. Its simplicity and power makes ellipsometry an ideal surface analytical tool for many objects in colloidal and interface science, polymer science for corrosion, metal research or in the filed of bio sensing.
A typical ellipsometric experiment is depicted in the following Figure.
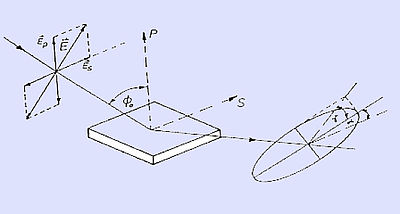
Light with a well defined state of polarization is incident on a sample. The reflected light usually differs in its state of polarization and these changes are measured and quantified in an ellipsometric experiment.
There are various ways for an automatization of an ellipsometer. A good review is presented in the following book chapter.
H. Motschmann, R. Teppner
Ellipsometry in Interface Science,
in Novel methods to Study Interfacial Layers, edited by R. Miller, D. Moebius
download the PDF
Imaging ellipsometry
 | Imaging ellipsometry combines the high vertical resolution of ellipsometry in the Angstroem range with the lateral resolution of conventional light microscopy. The constrast giving mechanism is the change in the state of polarization upon reflection. Imaging ellipsometry is an excellent tool to semi quantitatively assess surface layer and to visualize surface morphologies. |
more about imaging ellipsometry
Many real samples are inhomogeneous due to grain boundaries, surface roughness, or textures. These surface features have a strong impact on the reflectivity properties of the sample. Two length scales have to be distinguished. Imhomogeneities below 1 micrometer cannot be resolved by Imaging ellipsometry, instead they may cause a depolarization of the reflected light.
|
|  |
Inhomogenities exceeding 1 micrometer are best described by an incoherent superposition of the individual rays of each homogeneous patch of the reflecting surface. The lateral inhomogeneity of the sample is transformed in the state of polarization of the reflected light. With the aid of proper imaging optics an ellipsometric image is formed which resemble the high vertical resolution of conventional ellipsometry for each homogeneous patch of the surface. The lateral resolution is on the order of 1-2 micrometer and is given by the numerical aperture of the objective.
Imaging ellipsometry requires the image formation under an oblique angle of incidence. This imposes a specific problem. Depending on the angle of incidence, and the numerical aperture of the lens system, only a limited region of the illuminated part of the sample is in focus. This region is of the order of 5-50 Micrometer depending on the properties of the lens system. This problem is illustrated in the following Figure using a high magnifying lens system.
|
| 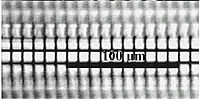 |
The stripe in the center of the image is in focus and towards the edges the image is blurred. This sample consists of a photo chemically patterned monolayer. The size of a bar is 1.9 micrometer the mesh size is 10 micrometer and imaging was performed at 53 degrees. The difference in height between dark and bright region is 0.7 nm. Obviously imaging at an oblique angle of incidence faces a severe limitation which is especially pronounced at higher magnifications. The area in focus decreases with the magnification.
Surface plasmons
 | Surface plasmon (SP) is a charge-density oscillation at the interface of two media with dielectric constants of opposite signs, for instance, a metal and a dielectric. Therefore monitoring of SP resonance parameters gives information about the interfacial architecture, mass coverage, thickness and optical constants of adsorbed layers. |
more about SP resonance
The main advantage of the SPR resonance is the localization of the electric field close to the interface. The plasmon is only sensitive to changes at the interface and the bulk has only little impact on the plasmon. Unfortunately surface plasmons can only be formed in a couple of metals such as gold or silver.
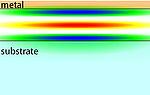
The charge density wave is associated with bound TM-polarized electromagnetic wave at the metal dielectric interface. The electric field of this wave has its maximum at the interface and decays evanescently into both media. Any change in refractive index of the bulk or the binding events lead to a shift in the SPR resonance.
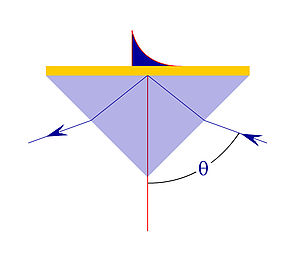
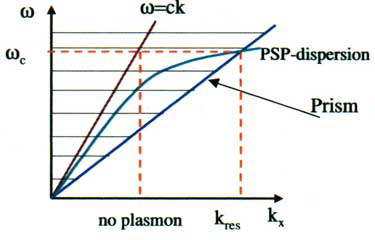
The excitation of a surface plasmon requires a special geometry. It turns out that is impossible to excite a surface plasmon within a simple reflection experiment. One of the mandatory condition for the excitation of SPR resonance is that the projection of the wavevector k_x of light matches the one of the plasmon. As sketched in the following figure it turns out that the dispersion relation of light in air omega(k) has no intersection with the corresponding curve of the plasmon. As a consequence the reflection of light at a metal surface does not lead to the formation of a plasmon provided that air is the ambient media. A trick helps to fulfil the conditions. If light is incident in a media with a higher refractive index than air the slope of the straight line is changed and a intersection between the plasmon dispersion relation may occur. This is utilized in the so-called Kretschmann configuration.
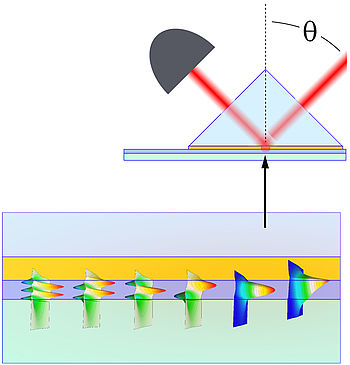
Angular resolved techniques using a prism in an ATR configuration have become the most common arrangement. The metal layer is at the base of a prism and the reflected intensity is measured as a function of the angle of incidence. The angle scan changes the projection of the wavevector k_x onto the prism base in a similar fashion as wavelength change.
|
| 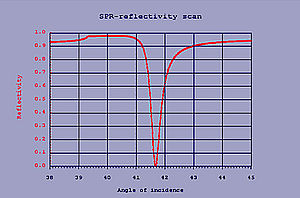 |
The excitation of the plasmon occurs in the total reflection regime. The exact position of the resonance bears information on the interfacial mass coverage or the thickness of an interfacial layer.
Brewster Angle Microscopy
 | Brewster angle microscopy (BAM) provides a valuable insight into the phase behavior of insoluble monolayers at the air-water interface. Amphiphilic monolayers are quasi two-dimensional systems and possess a large number of phases. Each phase may exhibit a different orientation, tilt azimuth or rotational degrees of freedom of the molecules. These features can be visualized by means of BAM. |
more about BAM
During the last decade Brewster angle microscopy has provided a valuable insight into the phase behavior of insoluble monolayers at the air-water interface. Amphiphilic monolayers are quasi two-dimensional systems and possess a large number of phases. Each phase may exhibit a different orientation, tilt azimuth or rotational degrees of freedom of the molecules. These features can be visualized by means of Brewster angle microscopy. The typical domain sizes are in the order of 20- 200 micrometers.
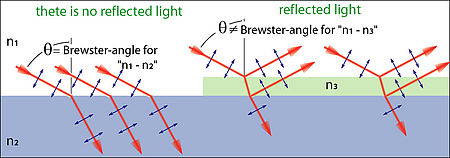
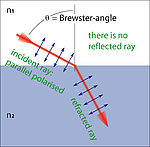
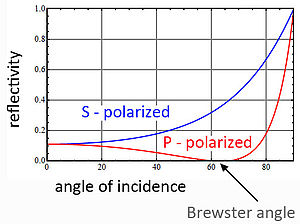
The existence of a Brewster angle is a pecularity of p-polarized light. The reflectivity coefficient Rp vanishes at the Brewster angle and hence no light is reflected there. A monolayer at the air-water interface yields a certain amount of reflected light, which is sufficient to produce an image.
The internal structure of domains can be detected. This technique is in many respects superior to fluorescence microscopy, since it does not require any label which could have an undesired impact on the systems.
Waveguide modes
 | Waveguide modes are the technique of choice for the characterization of films with a thickness greater than 500 nm. A very high precision in the layer characterization is achieved that cannot be matched by any other technique. |
more about waveguide modes
A waveguide is region with an elevated refractive index as compared to the adjacent media. The layer must have a minimum thickness in order to support waveguide modes.
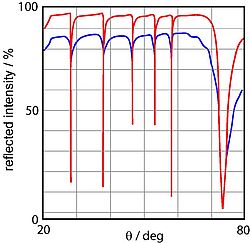
Excitation of waveguide modes requires a special experimental geometry. One common arrangement uses a prism coated on its base with a thin metal layer. The experiment consists in the measurement of the intensity of the reflected light as a function of the angle of incidence. At certain distinct angles, wave guide modes are excited.
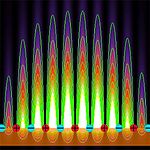
The energy of incident light is then partly transferred to the wave guide mode and as a result a minimum in the reflected intensity is observed. The measurement may contain several dips in the reflectivity. Each minimum refers to a to a specific mode with a characteristic field distribution characterized by the number of nodal planes.
 | TE modes are only affected by the thickness and the refractive index ny in the direction of the electric field. TM modes are affected only by the thickness, nx and nz, hence polarization dependent measurements are ideally suited for determining the properties of anisotropic samples. |
Measurements with different polarizations specifically question selected element of the anisotropic refractive index and the combined data lead to their independent determination. This is a major difference to ellipsometric measurements. Here, all refractive index elements contribute simultaneously. As a consequence, the data analysis is complex and bears an inherent ambiguity.
Peter Karageorgiev - 12.11.2021 08:29